Understanding your usage and return on AI investment
Theta Assist's time-savings calculators help you understand how Theta Assist is being used and what return you are getting from that usage.
Quick links
Thread-level insights
All users can see their own token usage and estimated time saved in Theta Assist. This gives you a quick way to understand the value of your own work.
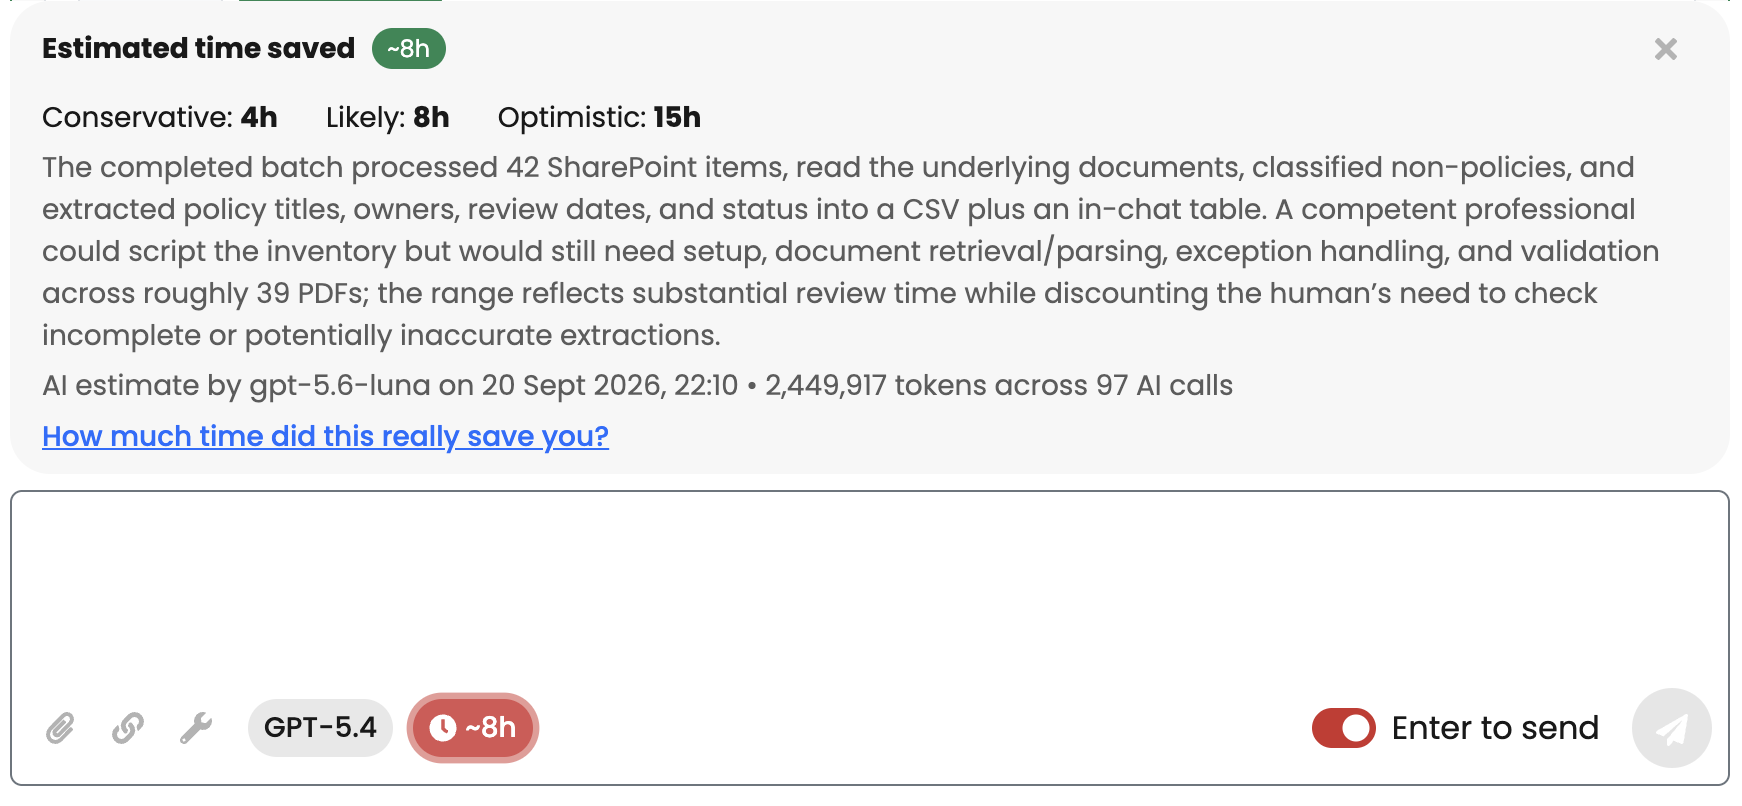
The estimated time saved summary appears in the thread and shows:
- Conservative, Likely, and Optimistic time-saved estimates
- a short explanation of what the thread completed
- the model used for the estimate
- the date and time of the estimate
- the number of tokens used across the thread
- the number of AI calls included in the estimate
Use thread-level feedback when you want to:
- correct an estimate that is too high or too low
- capture context that the AI could not know
- improve confidence in organisation-level reporting
User-level insights
Individual users can now (or soon) review their own usage across assistants and threads via the Insights menu.
You can look at:
- Activity
- Token usage
- ROI (return on investment)
Depending on your role, you may be able to access on each screen
- My usage for your own activity
- My assistants for assistants you own or manage
- Organisation for broader organisation-level reporting - available to admins and analytics users only.
Use the filters
Use the filters on each screen to narrow the data to the period and assistants you want to review.
- Time Range lets you choose a preset period such as the last 90 days
- Interval changes how the chart groups data, such as daily
- Average staff hourly rate changes the dollar value calculation (ROI screen)
- Assistant Filter lets you focus on one or more assistants
If you want to compare value over time, keep the same hourly rate and change only one filter at a time.
Read the time saved chart
The Time Saved Over Time chart shows how estimated time saved changes across the selected period.
The chart can include:
- Conservative estimate
- Likely estimate
- Optimistic estimate
- Effective (human-adjusted) estimate
The effective line reflects human feedback where it has been provided. This means it can be a better guide to real-world value than AI-only estimates.
Review time saved by assistant
The Time Saved by Assistant table helps you compare assistants side by side.
For each assistant, you may see:
- Threads
- Tokens
- Feedback
- Conservative
- Likely
- Optimistic
- Effective
Use this table to identify which assistants are creating the most value, which assistants are using the most tokens, and where human feedback has already been added.
If an assistant has high token usage but low effective time saved, it may need prompt, workflow, or scope improvements.
Review time saved by scheduled job
The Time Saved by Scheduled Job table shows the unattended portion of work completed by scheduled jobs.
These rows sit inside their assistant totals, so they do not add extra time on top of the assistant row. Use this section when you want to understand how much value is coming from automated recurring work.
Tips for interpreting ROI
- Use likely as your default planning figure unless you have strong reason to use the conservative or optimistic range.
- Use effective when human feedback has been added and you want the most grounded view.
- Review both time saved and tokens used together. High value with low token usage usually indicates strong efficiency.
- Check assistant-level and thread-level detail before drawing conclusions from a single spike.
- Encourage users to add feedback on important threads so the effective estimate becomes more useful over time.
Related information