Usage analytics
Usage analytics help individual users understand their own use and system administrators understand how Theta Assist is being used across the organisation. You can use the analytics dashboards to see usage patterns, identify popular assistants, review token consumption, and investigate unusual spikes in activity.
Quick links
Prerequisites
You must be logged in and have the analytics or system administrator role to access organisation-wide usage analytics.
All users have access to their own usage data via the Insights menu.
Get started with usage analytics
- Open the dashboard
Go to Admin > Monitoring, then choose Analytics or Token Usage - Choose a time range
Select a preset time range, or use a custom date and time range. - Apply filters
Narrow the results by assistant, user, source, interval, or investigation preset. - Review the summary cards and charts
Use the totals, averages, and charts to understand overall patterns. - Investigate unusual results
Use detailed tabs such as rankings, source, model, or spike finder to work out what is driving activity.
Analytics dashboard
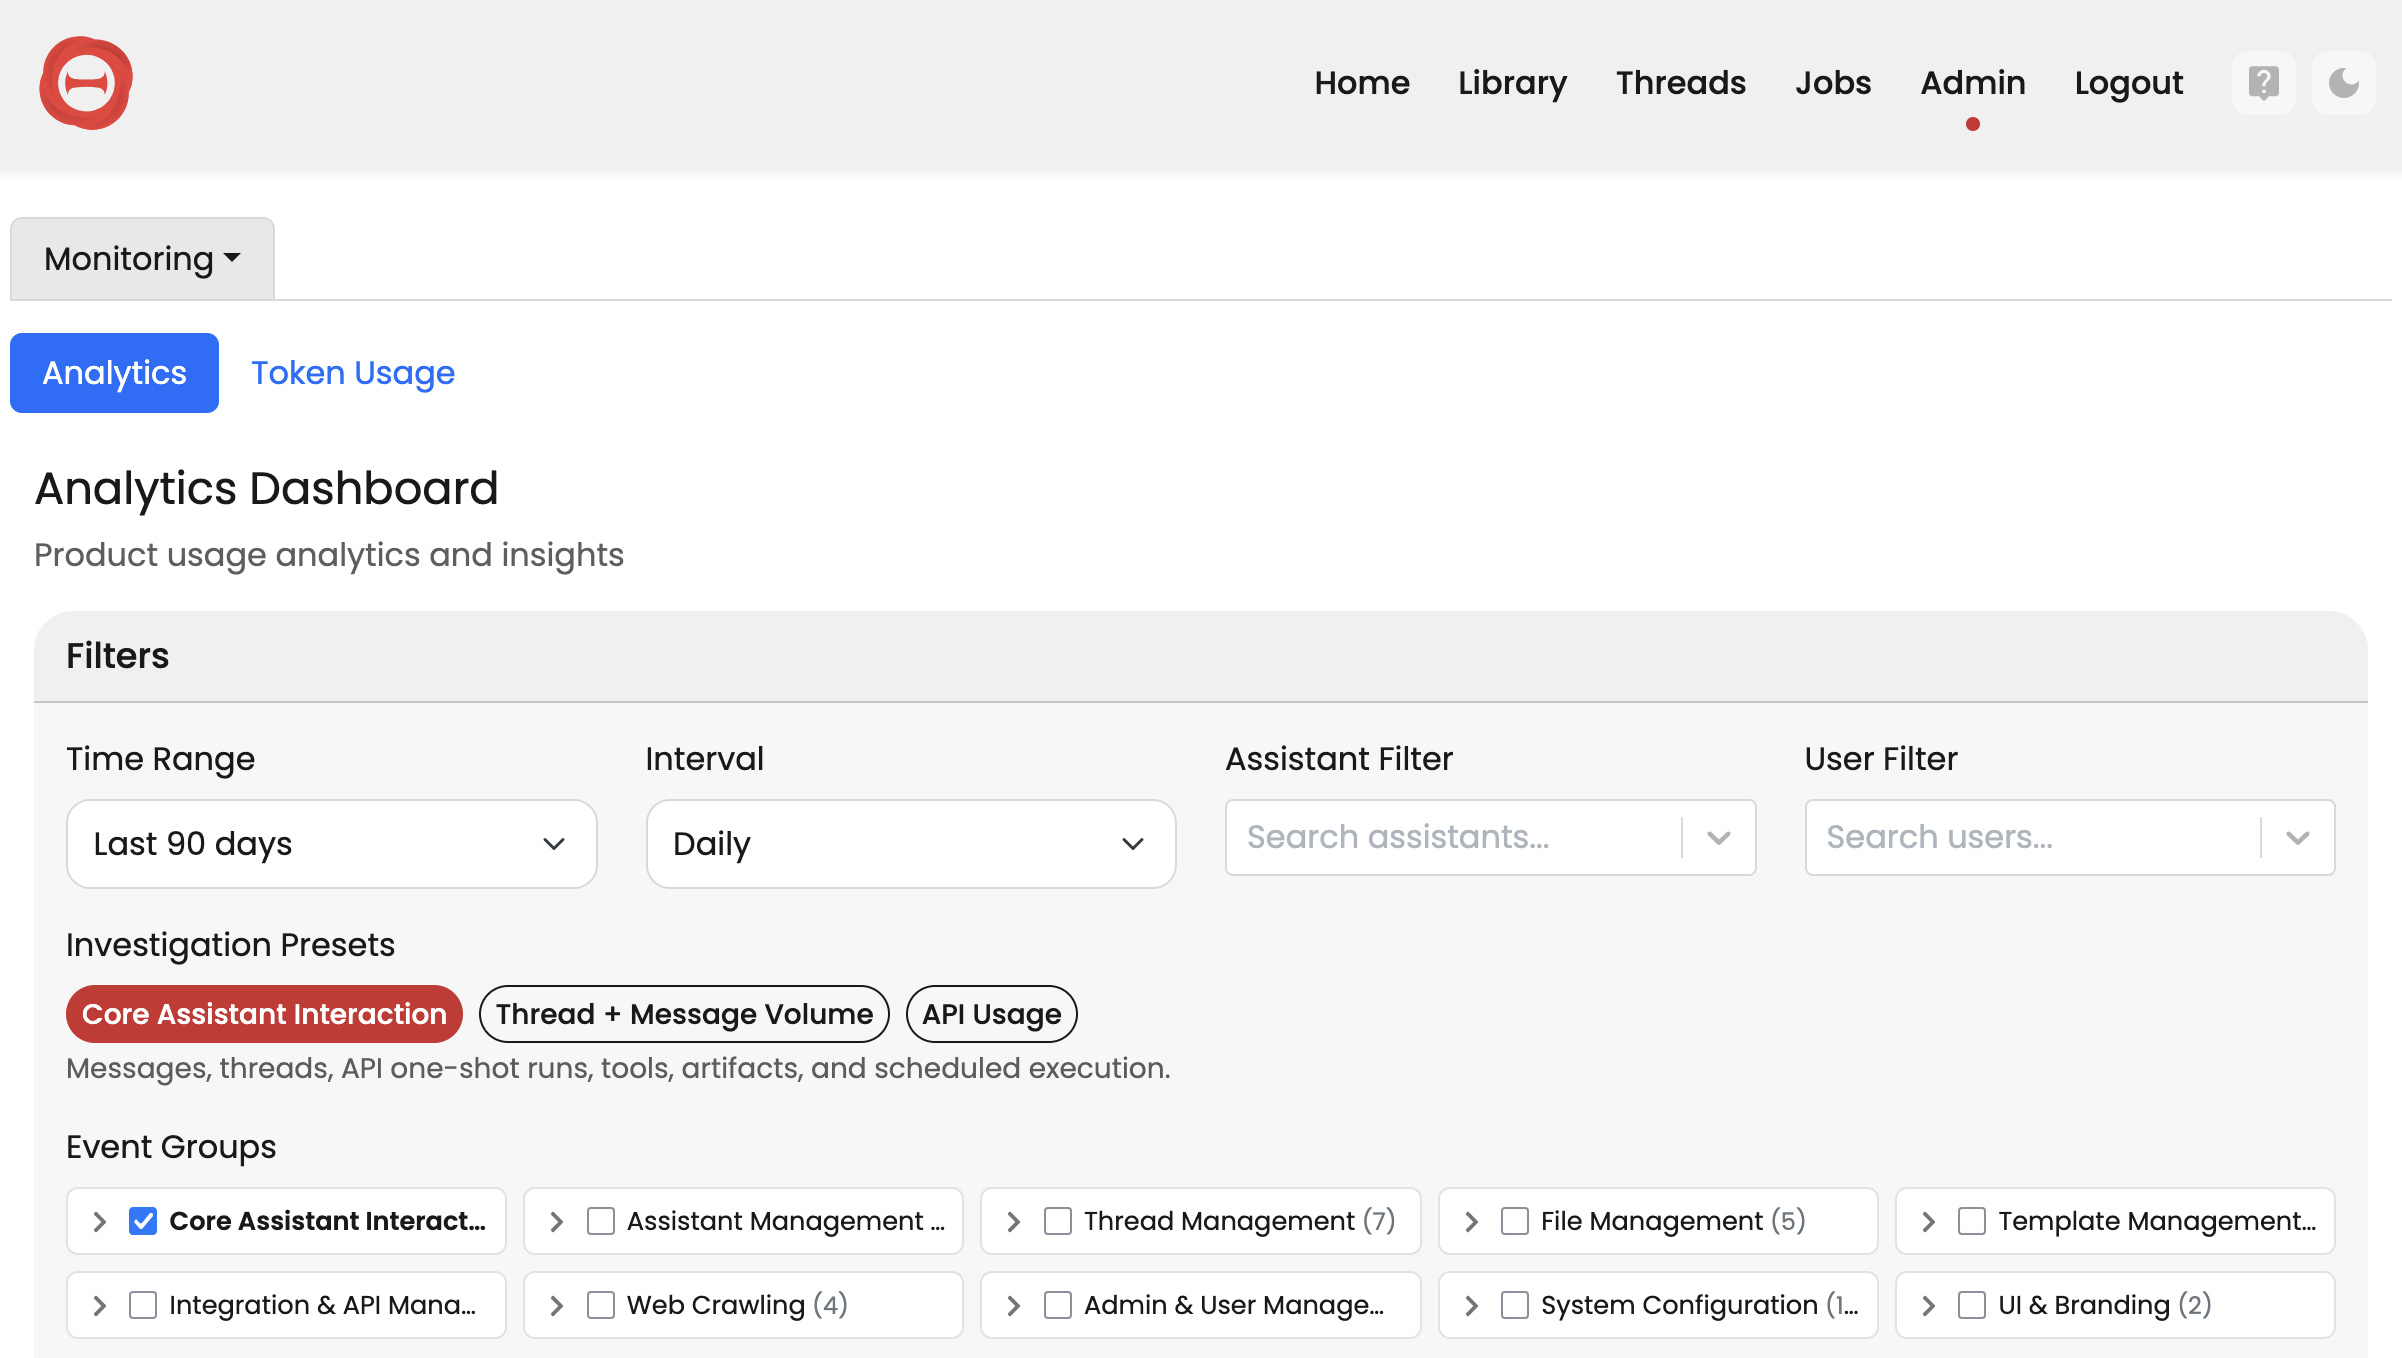
The Analytics dashboard shows product usage analytics and insights.
You can use it to answer questions such as:
- Which assistants are most popular?
- Who are your power users?
- What are the usage patterns over time?
- Which parts of the product are being used most?
The dashboard includes filters and investigation options to help you focus on specific activity.
Investigation presets
Investigation presets help you switch quickly between common usage views.
Examples include:
- Core assistant interaction
- Thread + message volume
- API usage
These presets make it easier to review a category of activity without manually selecting each event group.
Event groups
Event groups let you focus on a specific area of product activity.
Examples include:
- Core assistant interaction
- Assistant management
- Thread management
- File management
- Template management
- Integration and API management
- Web crawling
- Admin and user management
- System configuration
- UI and branding
Use event groups when you want to narrow the dashboard to one type of activity.
Token usage
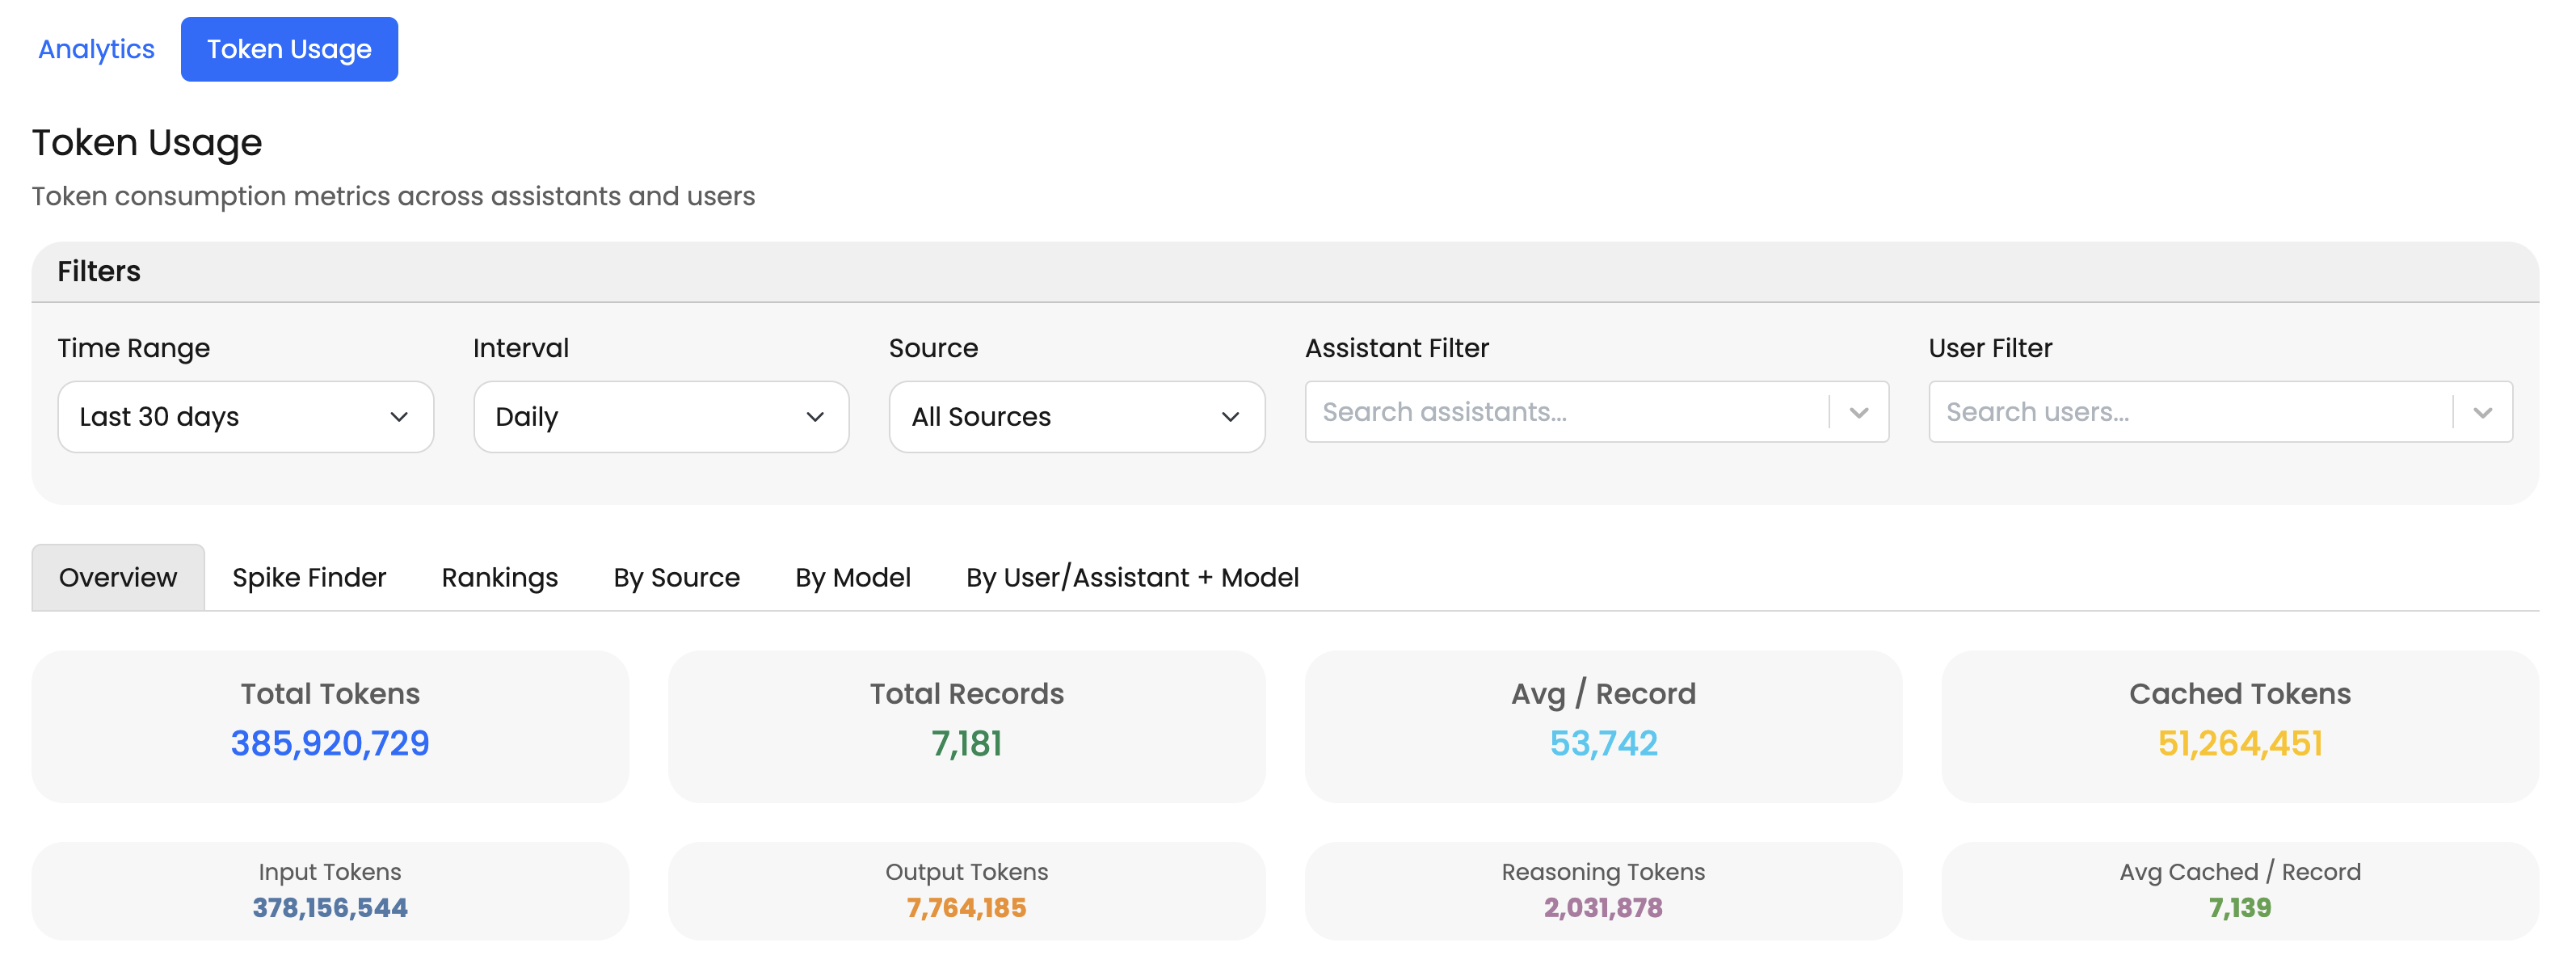
The Token Usage dashboard helps you understand token consumption across assistants and users.
You can use it to investigate:
- which users are consuming the most tokens
- which assistants are consuming the most tokens
- which models are driving token usage
- whether cached tokens are helping reduce effective API cost
- whether a spike is linked to a specific user, assistant, model, or source
Available views
The current Token Usage dashboard includes views such as:
- Overview
- Spike Finder
- Rankings
- By Source
- By Model
- By User/Assistant + Model
Rankings
The Rankings view helps you see the top users and assistants by total token consumption in the selected time range.
Depending on the data available, you may also see values such as:
- total tokens
- input tokens
- output tokens
- cached tokens
- reasoning tokens
- records
By source and by model
Use By Source and By Model to understand where token usage is coming from.
This is useful if you want to compare:
- different types of activity
- different models
- patterns over time
By user/assistant + model
Use By User/Assistant + Model when you need a more detailed breakdown.
This view can help you identify which user and model, or which assistant and model, is driving token usage.
Filters
Both dashboards include filters to help you narrow the data.
Depending on the dashboard, filters may include:
- Time range
- Interval
- Source
- Assistant filter
- User filter
Use filters to:
- review one assistant
- review one user
- compare a short time period such as an hour or a day
- focus on a specific source of activity
- investigate a known spike
Spike finder
Spike Finder is designed to help you investigate unusual token usage.
A practical way to use it is:
- Spot the spike in a chart or summary.
- Set the same date and time range in the filters.
- Open Spike Finder.
- Review the breakdown by user, assistant, model, or source.
This makes it easier to work out what caused a sudden increase in token consumption.
Tips for investigating unusual usage
- Start with a broad time range, then narrow it once you find the period you need.
- Use Analytics to understand overall product activity.
- Use Token Usage when you need to investigate spend or model usage.
- Use rankings to quickly identify high-usage assistants or users.
- Use spike finder when a chart shows a sudden jump.
- Switch filters one at a time so it is easier to see what changed.